Machine learning systems trained to minimize prediction error may often exhibit discriminatory behavior based on sensitive characteristics such as race and gender. One reason could be due to historical bias in the data. In various application domains including lending, hiring, criminal justice, and advertising, machine learning has been criticized for its potential to harm historically underrepresented or disadvantaged groups.
In this post, we talk about our recent work on aligning decisions made by machine learning with long term social welfare goals. Commonly, machine learning models produce a score that summarizes information about an individual in order to make decisions about them. For example, a credit score summarizes an individual’s credit history and financial activities in a way that informs the bank about their creditworthiness. Let us continue to use the lending setting as a running example.
Any group of individuals has a particular distribution of credit scores, as visualized below.
Scores can be turned into decisions by defining a threshold. For example, individuals above the threshold score are granted loans, and individuals below the score threshold are denied loans. Such a decision rule is called a threshold policy.
Scores can be interpreted as encoding estimated probabilities of defaulting on a loan. For example, 90% of people with a credit score of 650 may be expected to repay a loan granted to them. This allows the bank to forecast the profit they would expect to make by providing identical loans to individuals with credit score 650. In the same fashion, the bank can predict the profit they would expect by loaning to all individuals with a credit above 650, or indeed above any given threshold.
Without other considerations, a bank will attempt to maximize its total profit. The profit depends on the ratio of the amount the bank gains from a repaid loan to the amount the bank loses from a defaulted loan. In the above interactive figure, this ratio of gain to loss is 1 to -4. As losses become more costly relative to gains, the bank will issue loans more conservatively, and raise its loaning threshold. We call the fraction of the population above this threshold the selection rate.
The outcome curve
Lending decisions not only affect the institution, but the individuals as well. A default event (a borrower’s failure to repay a loan) not only diminishes profit for the bank; it also worsens the credit score of the borrower. A successful lending outcome leads to profit for the bank and also to an increase in credit score for the borrower. In our running example, the ratio of the change in credit scores for a borrower is 1 (repaid) to -2 (defaulted).
For threshold policies, the outcome, defined as expected change in score for a population, can be parametrized as a function of the selection rate; we call this function the outcome curve. As the selection rate in one group varies, the outcome experienced by the group also varies. These population-level outcomes depend both on the probability of repayment (as encoded by the score), and cost and benefit of the loaning decision to the individual.
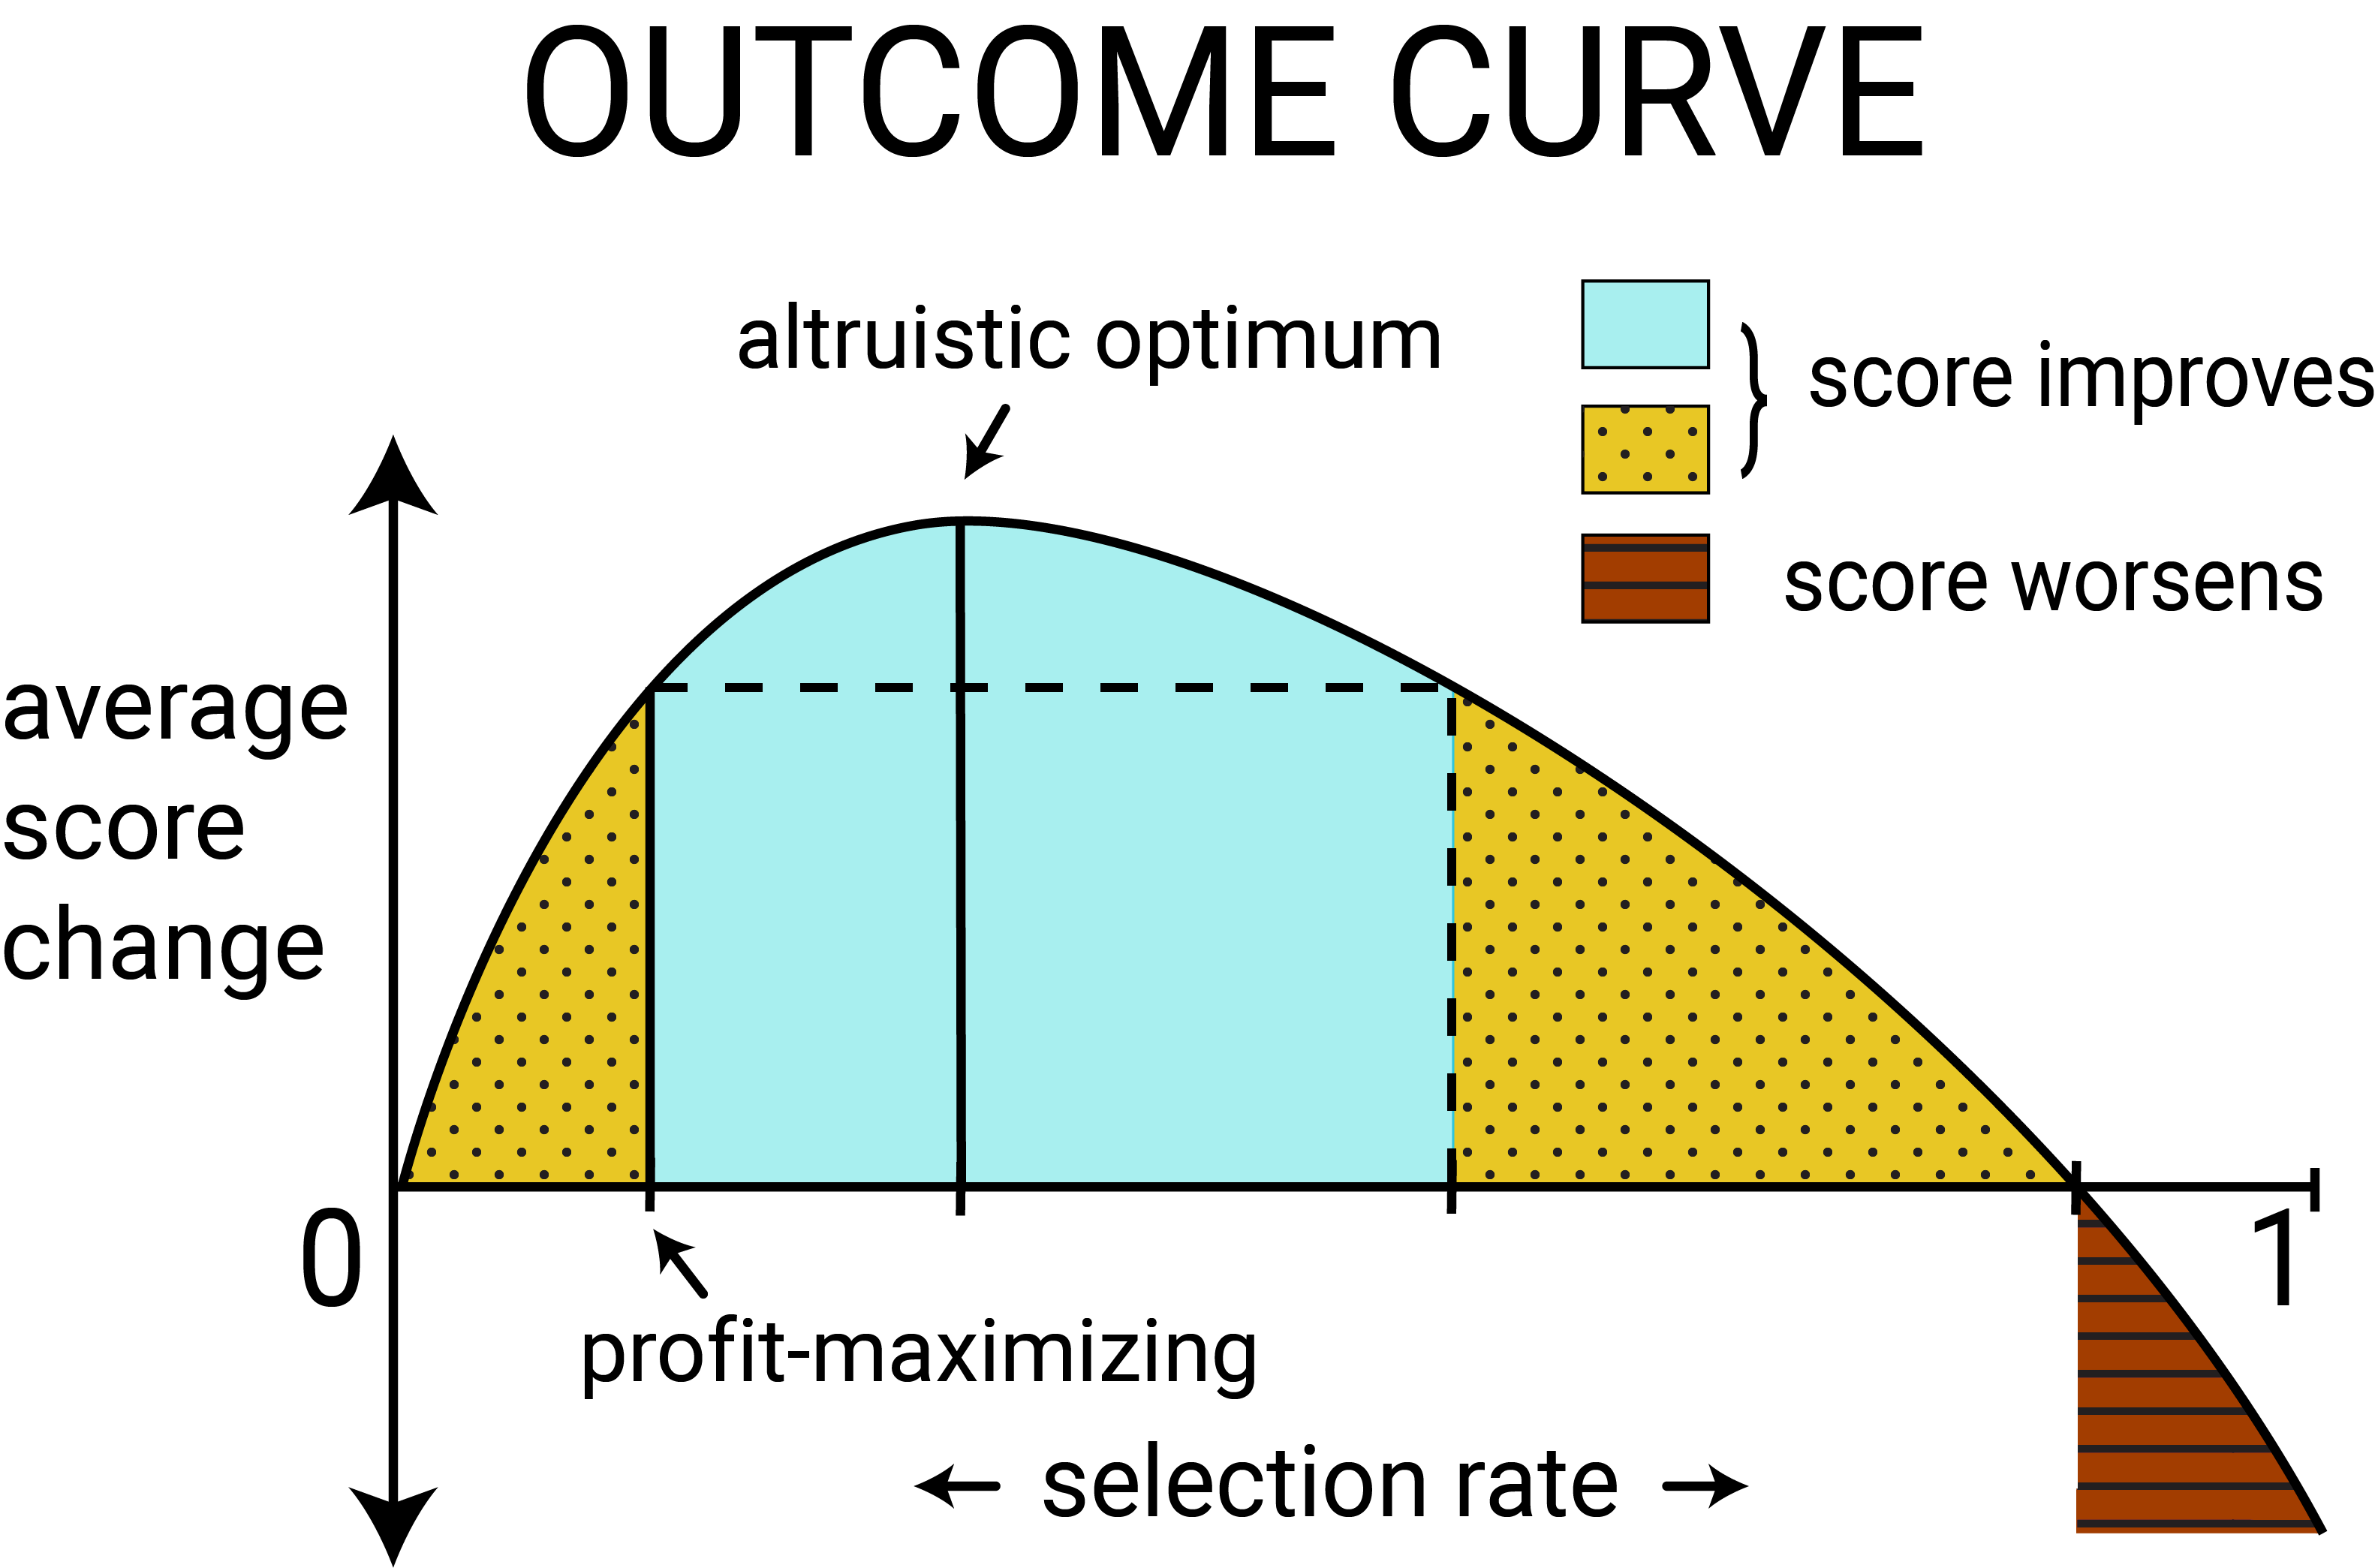
Figure 3
The above figure shows the outcome curve for a typical population. When enough individuals in a group are granted loans and successfully repay them, the average credit score in that group is likely to increase. Unconstrained profit-maximization results in a positive average score change in the population in this case. As we deviate from profit maximization to give out loans to more people, the average score change increases up to a certain point where it is maximized. We may call this the altruistic optimum. We can also increase the selection rate up to a point where the average score change is lower than under unconstrained profit-maximization but still positive, as illustrated by the dotted yellow regions. We say that selection rates in the dotted yellow regions are causing relative harm. However, if too many individuals are unable to repay their loans, the average credit score for the group will decrease, as is the case in the red striped region.
Multiple groups
How does a given threshold policy affect individuals across different groups? Two groups with different distributions of credit scores will experience different outcomes.
Suppose the second group has a distribution of credit scores that is different from the first group, and also has fewer people. We can think of this group as a historically disadvantaged minority. Let’s denote this group as the blue group; we would like to ensure that the bank’s lending policy doesn’t hurt or shortchange them disproportionately.
We imagine the bank can choose different thresholds for each group. While group-dependent thresholds may face legal challenges, they are inevitable in avoiding the differential outcomes that a fixed-threshold decision could invoke.
It makes sense to ask what choices of thresholds lead to an expected improvement in the score distribution within the blue group. As we mentioned before, an unconstrained bank policy would maximize profit, choosing thresholds that meet a break-even point above which it is profitable to give out loans. In fact, the profit-maximizing threshold (a credit score of 580) is the same for both groups.
Fairness Criteria
Groups with different distributions over scores will have differently shaped outcome curves (see the top half of Figure 6, which shows outcome curves resulting from actual credit score data and a simple outcome model). As an alternative to unconstrained profit maximization, one might consider fairness constraints, which equalize decisions between groups with respect to some objective function. A variety of fairness criteria have been proposed to protect the disadvantaged group by an appeal to intuition. With a model of outcomes, we are now equipped to answer concretely whether fairness constraints actually encourage more positive outcomes.
One frequently proposed fairness criterion, demographic parity, requires the bank to lend to both groups at an equal rate. Subject to this requirement, the bank would continue to maximize profit to the extent possible. Another criterion, equality of opportunity, equalizes the true positive rates between the two groups, requiring the bank to lend in both groups at an equal rate among individuals who will repay their loan.
While these fairness criteria are a natural way to think about equalizing static decisions, they often ignore the future effects these policies have on population outcomes. Figure 6 illustrates this point by contrasting the policies resulting from max profit, demographic parity and equal opportunity. Try selecting each loan strategy to see the bank profit and credit score change they result in! Both demographic parity and equal opportunity reduce the bank’s profit compared to max profit. But do they improve the outcome of the blue population over max profit? While the max profit strategy underloans to the blue population relative to the altruistic optimum, equal opportunity overloans relative to the altruistic optimum, and demographic parity overloans to the point of causing relative harm in the blue population. Can you find the thresholds that lead to the altruistic optimum? Try it out in the interactive visualization!
If the goal of employing fairness criteria is to increase or equalize long term well-being over all populations, we’ve just shown that there are scenarios where fairness criteria actually act against this objective. In other words, fairness constraints can also reduce welfare in already disadvantaged populations. Constructing an accurate model to forecast the effects that decisions have on population outcomes may help to mitigate possible unanticipated harms of applying fairness constraints.
Considering outcomes for “fair” machine learning
We advocate for a view toward long-term outcomes in the discussion of “fair’’ machine learning. Without a careful model of delayed outcomes, one cannot foresee the impact a fairness criterion would have if enforced as a constraint on a classification system. However, if an accurate outcome model is available, there are more direct ways to optimize for positive outcomes than via existing fairness criteria. Specifically, the outcome curve gives us a way to deviate from the maximum profit strategy in a way that most directly improves outcomes.
An outcome model is a concrete way to incorporate domain knowledge into the classification process. This aligns well with much scholarship that points to the context-sensitive nature of fairness in machine learning. The outcome curve provides an interpretable visual device to highlight application-specific tradeoffs.
For more details, please check out the full version of our paper, which will also appear at the 35th International Conference on Machine learning in Stockholm, Sweden. Our work is only a start in exploring how outcome models can mitigate undesirable societal impacts of machine learning algorithms. We believe there is much more work to be done in order to ensure the long-term fairness of machine learning, as algorithms impact the lives of more people.
Acknowledgements. The authors would like to thank Martin Wattenberg and Fernanda Viégas for the interactive visualizations that inspired us and were used as reference for those in this post.